In the infographic below, you will find:


full Infograph and source: GamesIndustry.biz presents… The Year In Numbers 2024
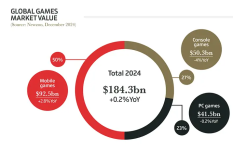
- The global games market value (courtesy of Newzoo)
- Total boxed vs digital revenues (also via Newzoo)
- The biggest mobile games, publishers and countries, both by revenue and downloads (thank you, Sensor Tower)
- The best-selling games in the UK (from Nielsen GfK), US (from Circana) and Japan (from Famitsu)
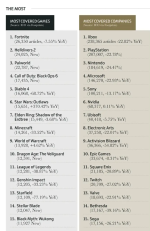
- The most covered games and companies, in terms of number of articles (provided by ICO via Footprints, based on data from over 18,000 websites)
- The biggest influencers on YouTube, most watched trailers and game promo videos, and the most popular video games on TikTok (courtesy of Fancensus)


full Infograph and source: GamesIndustry.biz presents… The Year In Numbers 2024

